

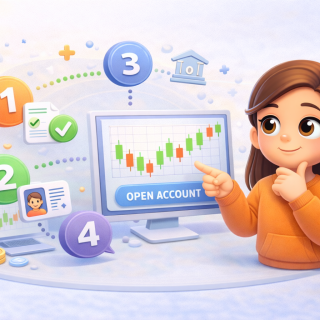

If you’ve started learning trading, you’ve probably come across the term technical analysis.
It sounds a little complicated just hearing the name alone.
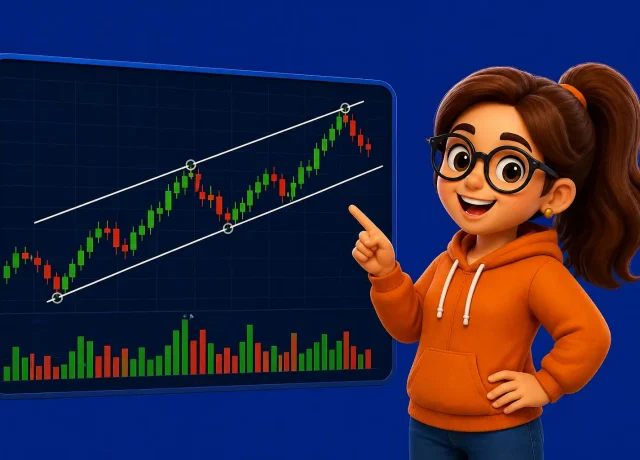
But in reality, technical analysis is much simpler than it looks. It’s just charts, lines, indicators, and patterns
In this guide, you’ll learn what technical analysis is, how it works, and why traders use it: explained in a clear and beginner-friendly way.
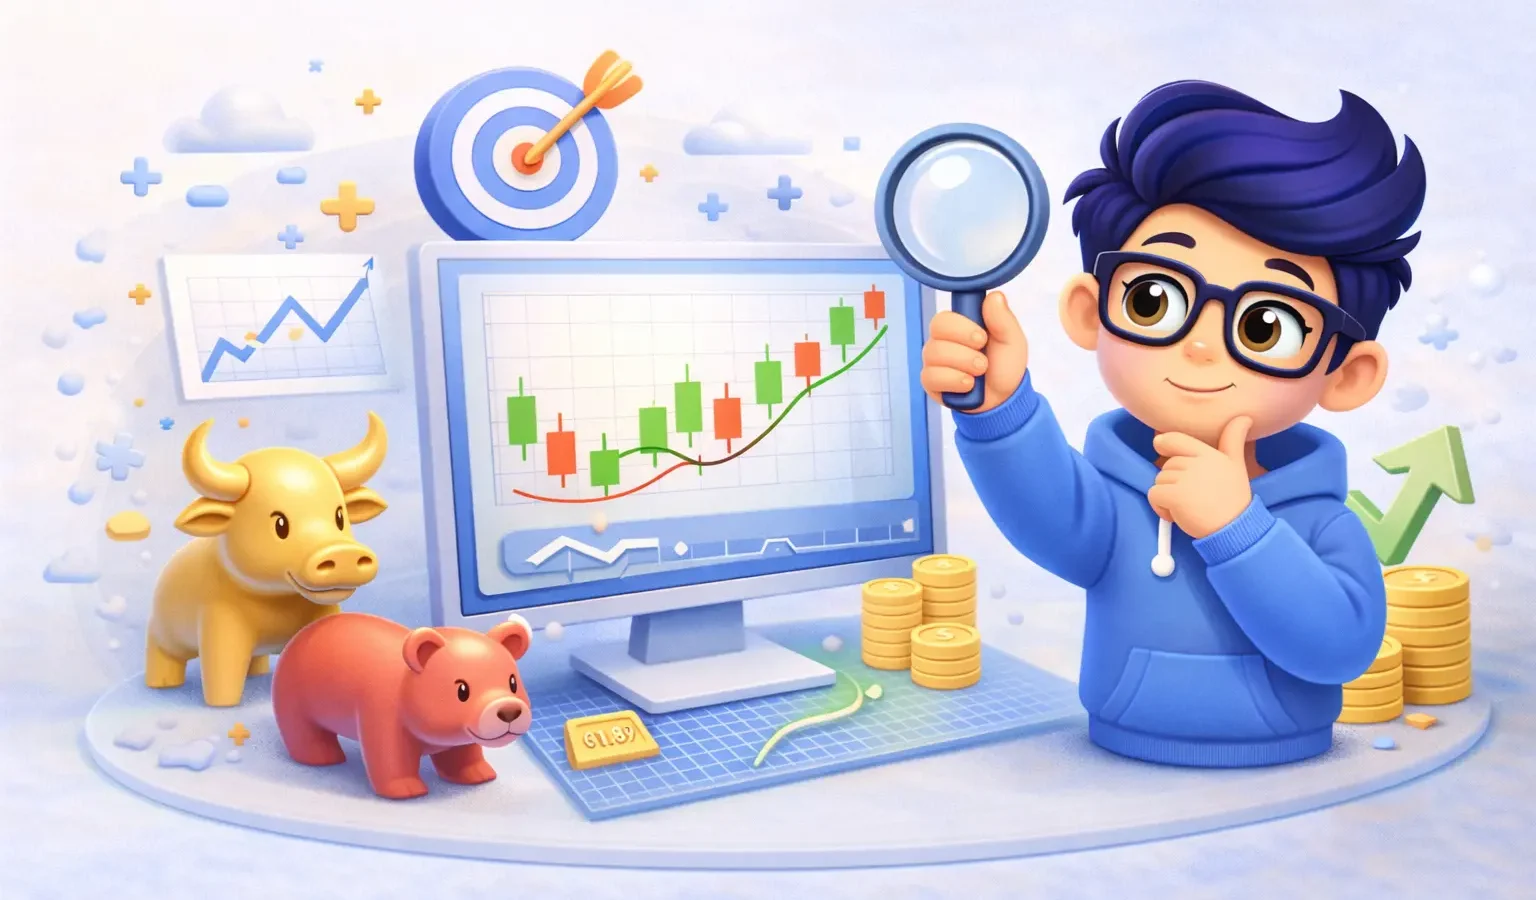
What Is Technical Analysis?
Technical analysis is the process of analyzing price charts to predict future market movements.
Instead of focusing on news or company data, technical analysis focuses on:
- price movement
- patterns
- trends
- historical data
The main idea is simple:
Price tends to repeat patterns over time, so if you watch well, you might come across what you’ve seen before and make decisions based on that with the help of other tools.
How Technical Analysis Works
Technical analysis works by studying how prices have moved in the past and using that information to make decisions.
Traders use tools like:
- charts
- trendlines
- support and resistance levels
- indicators (like RSI and moving averages)
These tools help traders identify patterns and possible future movements.
If you’re not familiar with charts yet, check out our guide on trading platforms (MT4, MT5, TradingView).
Why Technical Analysis Works
This is the question many beginners ask:
Why does technical analysis actually work?
The answer is not magic; it’s behavior.
People and algorithms drive markets, and both tend to react in similar ways over time.
This leads to patterns such as:
- price bouncing at the same levels
- trends forming over time
- Repeated chart patterns
Because many traders watch the same levels and patterns, they often react in similar ways, which creates consistency.
Key Concepts in Technical Analysis
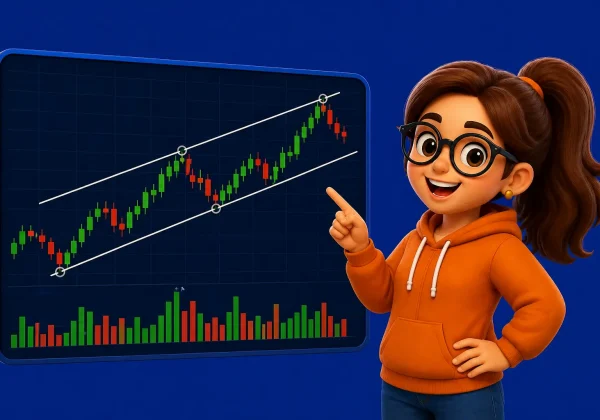
1. Trends
A trend shows the general direction of the market.
- Uptrend → price moving higher
- Downtrend → price moving lower
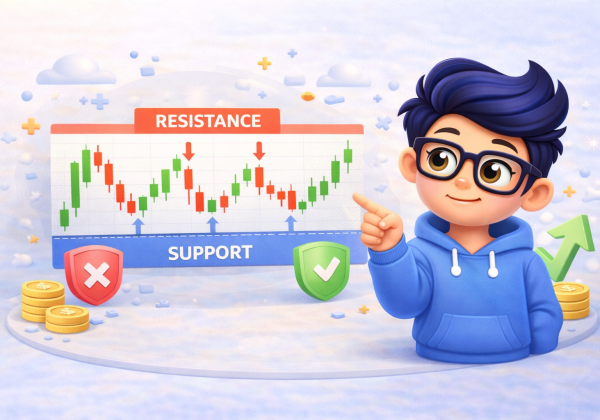
2. Support and Resistance
These are levels where price tends to stop or reverse.
- Support → price tends to go up
- Resistance → price tends to go down
3. Chart Patterns
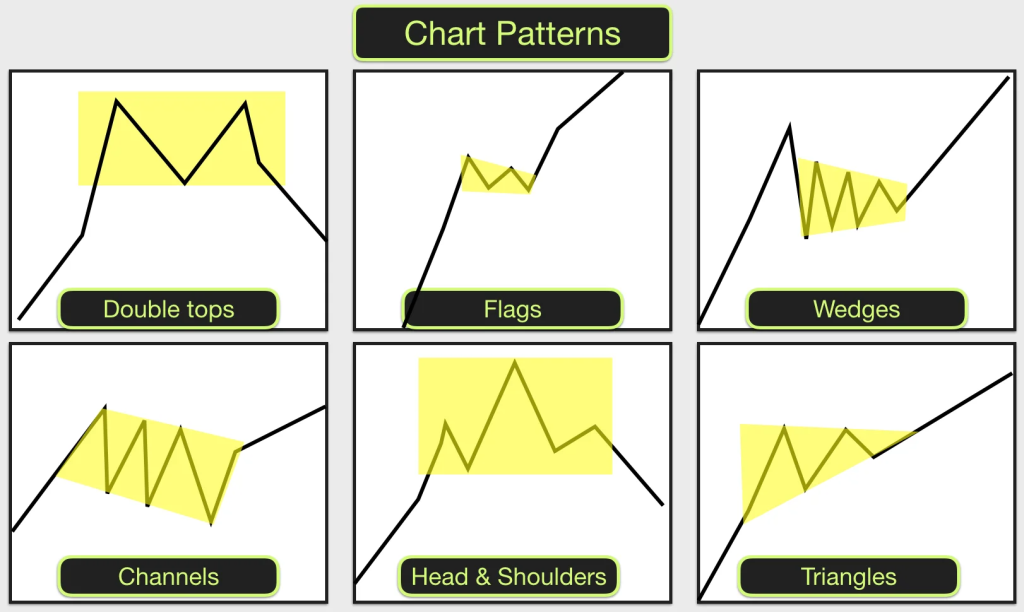
Patterns are more like the formation of the candles on the chart. They might form shapes like triangles, flags, and head & shoulders, which can signal possible future movements. You might not understand it now, but you’ll get it later so dont worry if you don’t.
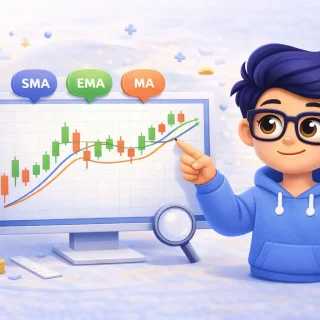
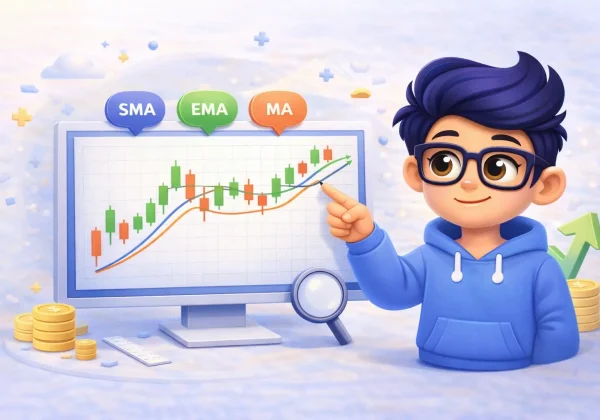
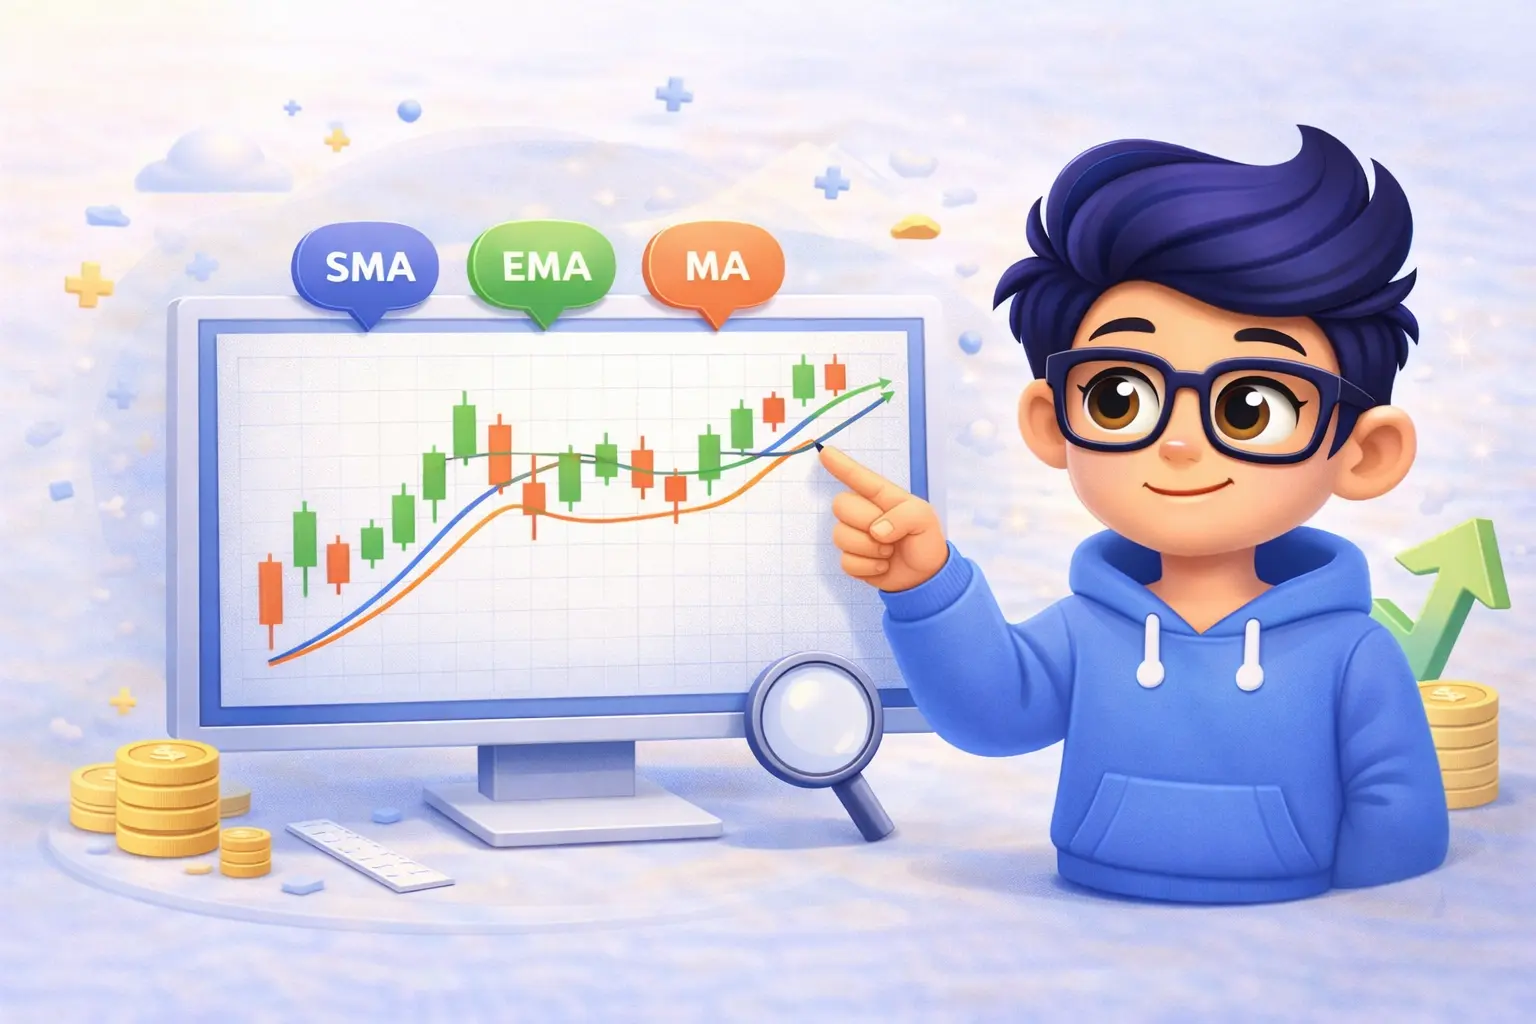
4. Indicators
Indicators are mathematical tools that help analyze price data.
Examples include:
- RSI -Relative Strength Index
- Moving averages
- MACD – Moving Average Convergence Divergence
I didn’t explain the examples above because at this point, all you need to know is that they exist, because if I explain it, you won’t get it, and you might even get confused.
Technical Analysis vs Fundamental Analysis
There are two main ways to analyze the market:
Technical Analysis
- focuses on charts and price
- used for short-term trading
Fundamental Analysis
- focuses on news and economic data
- used more for long-term investing
Many traders combine both approaches.
Is Technical Analysis Enough to Trade Successfully?
Technical analysis is powerful, but it is not everything.
To trade effectively, you also need:
- risk management
- discipline
- emotional control
👉 Learn more: risk management basics
Common Beginner Mistakes in Technical Analysis
- Using too many indicators
- Overcomplicating charts
- Ignoring risk management
- Expecting perfect predictions
Keep it simple; that’s where most traders improve.
How to Start Learning Technical Analysis
If you’re just starting, focus on:
- understanding charts
- learning trends
- identifying support and resistance
Don’t rush into complex strategies; they won’t help, they might even push you to lose hope in trading as a whole, because you’ll keep losing money and think Technical Analysis does not work.
Frequently Asked Questions (FAQ)
Is technical analysis reliable?
Technical analysis is not 100% accurate, but it helps traders make better decisions based on probabilities.
Can beginners use technical analysis?
Yes. In fact, most beginners start with technical analysis because it is visual and easier to understand.
Do professional traders use technical analysis?
Yes. Many professional traders use technical analysis, often combined with other methods.
Final Thoughts
Technical analysis is one of the most important skills in trading.
It helps you understand price behavior, identify patterns, and make better decisions.
Start simple, practice consistently, and improve over time.

5 Comments