


In Technical Analysis, trendlines is something you’ll hear a lot.
Trendlines are one of the simplest tools in trading, but they are also one of the most misused.
Many beginners draw them incorrectly, which leads to confusion and bad trading decisions.
In this guide, you’ll learn how to draw trendlines correctly, how they work, and how to use them in trading.
What Is a Trendline?
A trendline is a line drawn on a chart to show the direction of price movement.
It helps traders identify whether the market is:
- moving up (uptrend)
- moving down (downtrend)
Trendlines are a key part of technical analysis and help bring structure to your charts.
👉 Learn more: what is technical analysis
Types of Trendlines
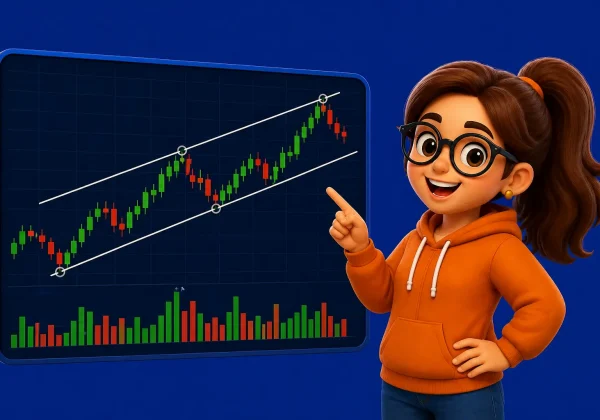
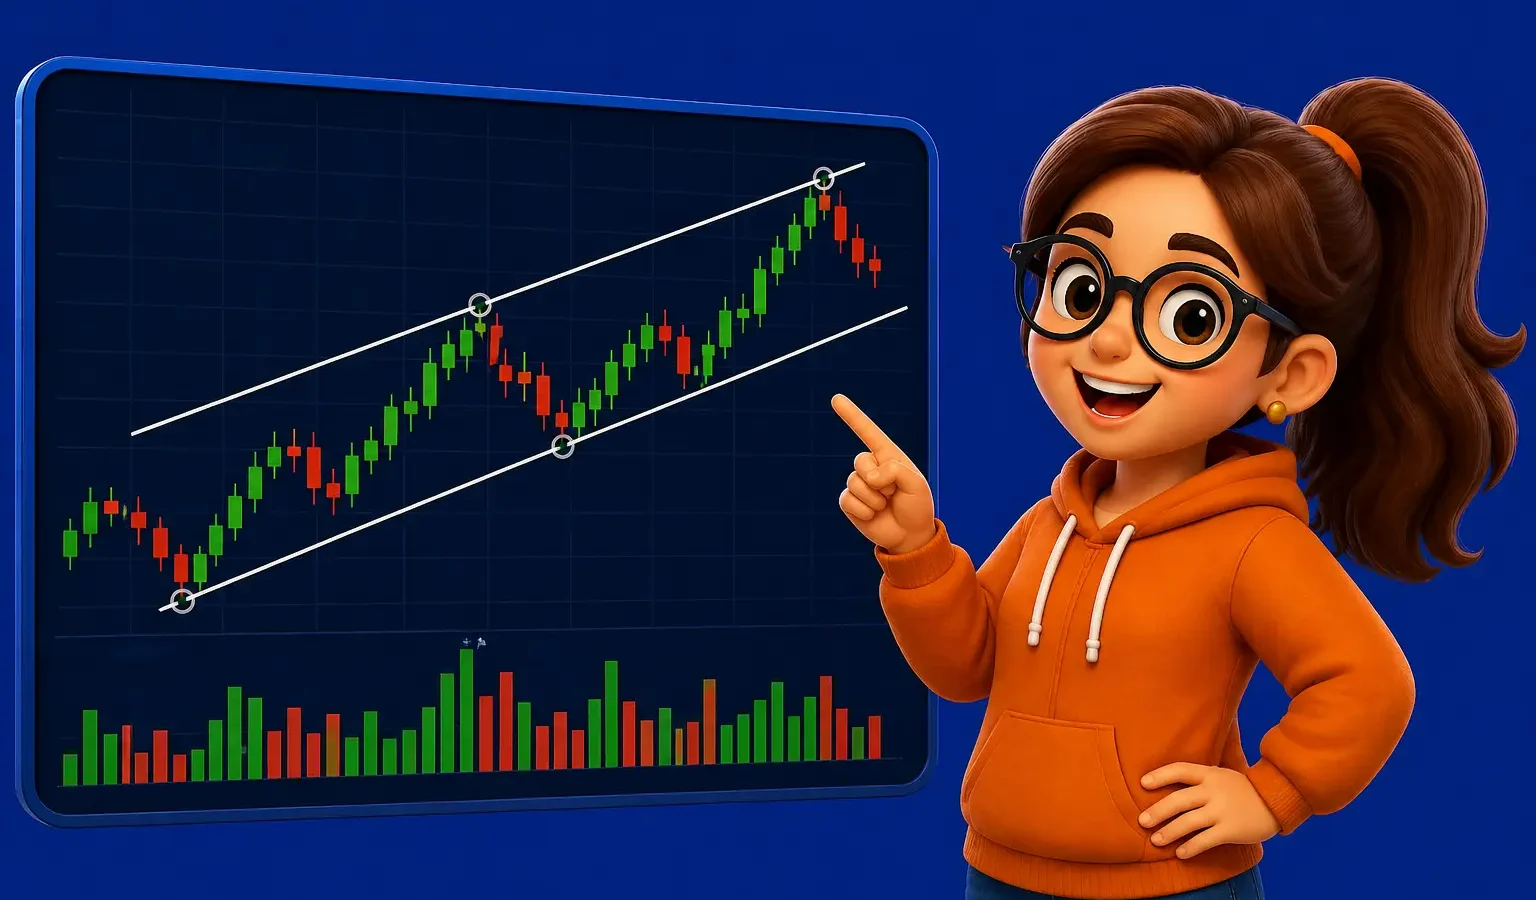
Uptrend Line
An uptrend line is drawn by connecting atleast two higher lows.
It shows that buyers are in control.
Downtrend Line
A downtrend line is drawn by connecting atleast two nlower highs.
It shows that sellers are in control.
How to Draw Trendlines Correctly
Drawing trendlines is simple once you follow a few rules.
1. Identify the Trend
First, determine if the market is moving up or down.
you can do this by just looking at the charts on your screen, it’s that obvious and also depends on your timeframe
2. Use At Least Two Points
You need at least two points to draw a trendline.
However, three or more touches make the trendline stronger.
3. Connect the Right Points
- Uptrend → connect higher lows
- Downtrend → connect lower highs
4. Avoid Forcing the Line
If the line doesn’t fit naturally, don’t force it.
A good trendline should be obvious. Don’t force it to fit or else you’ll make wrong moves with enough confidence to blow your account.
5. Focus on the Body and Wick
You can draw trendlines using candle wicks or bodies, but consistency is important. If you are using the wick make sure to use wick throughout and vice versa. Don’t mix them up just so they fit your lines
👉 Learn more: candlestick charts explained
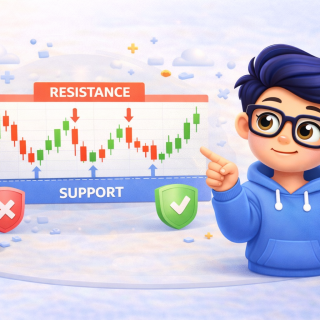
Why Trendlines Work
Trendlines work because they represent market behavior.
Traders often react at trendlines, creating:
- support in an uptrend
- resistance in a downtrend
This makes trendlines similar to support and resistance levels.
👉 Learn more: support and resistance explained
How Traders Use Trendlines
Traders use trendlines in different ways:
1. Identifying Trend Direction
Trendlines help confirm whether the market is trending up or down.
2. Finding Entry Points
Traders often enter trades when price touches their trendline.
3. Spotting Breakouts
When price breaks a trendline, it may signal a change in direction.
Trendline Breakouts
A trendline breakout happens when price moves beyond the trendline.
This can signal:
- a trend reversal
- a continuation move
However, not all breakouts are real.
Some are false breakouts, so it’s important to confirm signals.
Common Beginner Mistakes
- Drawing trendlines on random points
- Forcing lines to fit the chart
- Ignoring the overall trend
- Using trendlines without confirmation
Keep your charts clean and focus on clear structures.
Frequently Asked Questions (FAQ)
How many points are needed to draw a trendline?
At least two points, but three or more touches make it stronger.
Are trendlines reliable?
Trendlines are useful, but they should be combined with other tools for better accuracy.
Can beginners use trendlines?
Yes. Trendlines are one of the easiest tools to start with in trading.
Final Thoughts
Trendlines are simple but powerful tools in trading.
They help you understand market direction, identify key levels, and improve your analysis.
Practice drawing them regularly, and over time, you’ll get better at spotting trends.


1 Comment